Trivia Visualizer
Interactive charts showing quiz questions by category and difficulty.
- Area
- Data visualization
- Period
- October 2025
- Status
- Test assignment
Screenshots
03Captured from a local build with live Open Trivia DB data. The application has an English interface. Select an image to view full size.

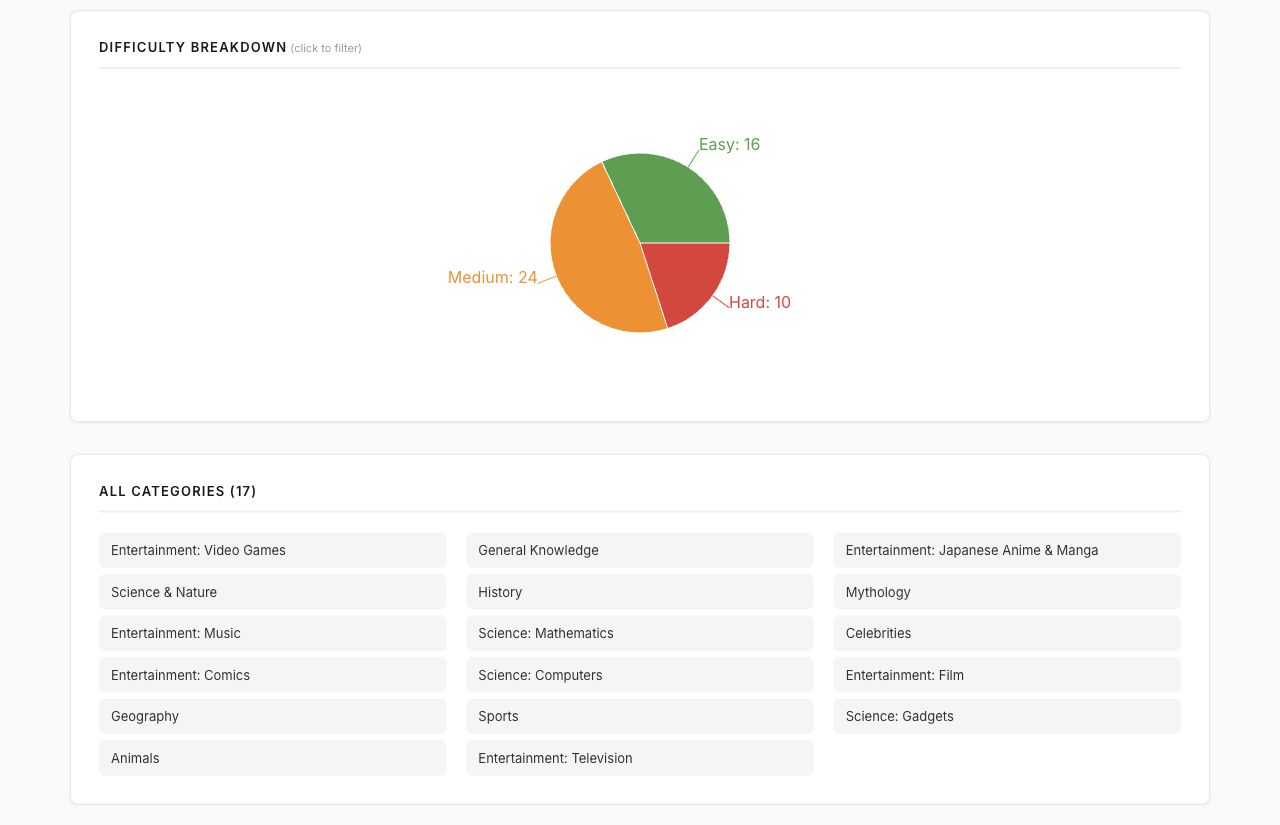
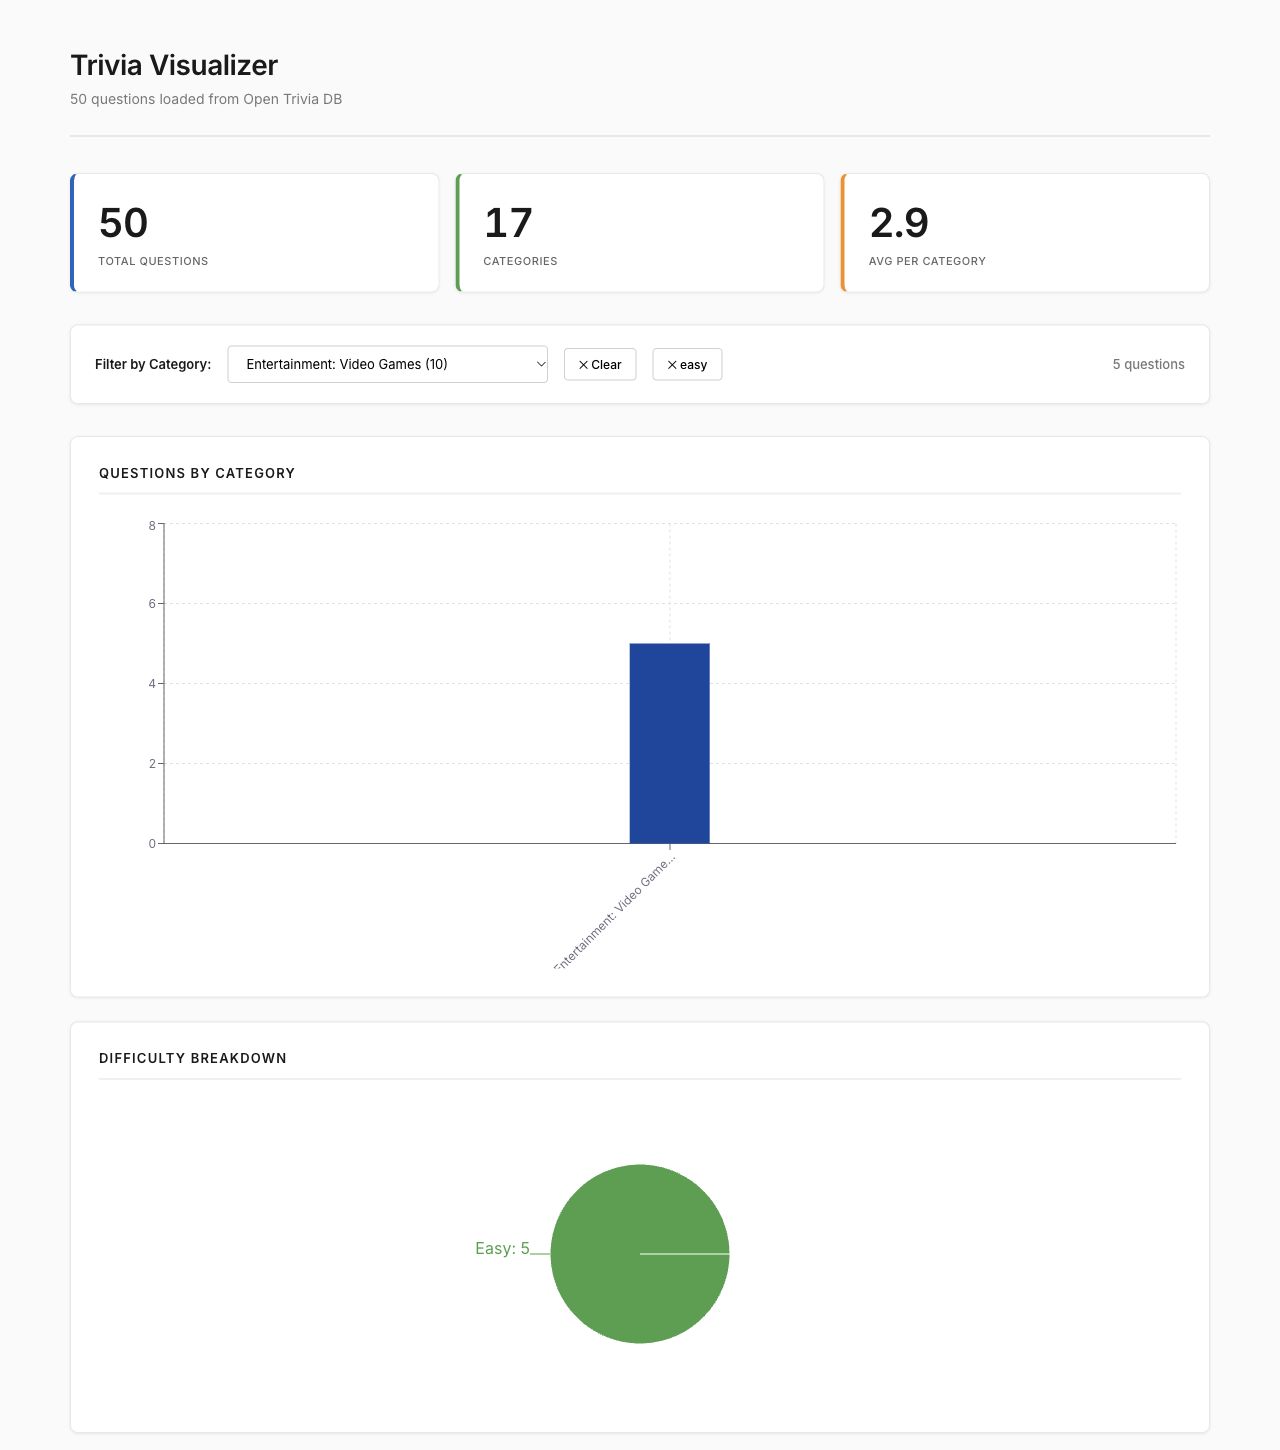
A small web application made as a test assignment. It loads 50 questions from Open Trivia DB and displays category counts, difficulty levels and summary statistics.
Features
- Bar and pie charts with tooltips
- Combined category and difficulty filters
- Selection through charts, a list or a dropdown
- Responsive layout and loading placeholders
Tech stack
React, TypeScript, Recharts, CSS, Fetch API, Create React App
Project status
A test assignment. Uses the public Open Trivia DB API.